To visualizae financial data using R.
To model, analyse and visualise network data using R.
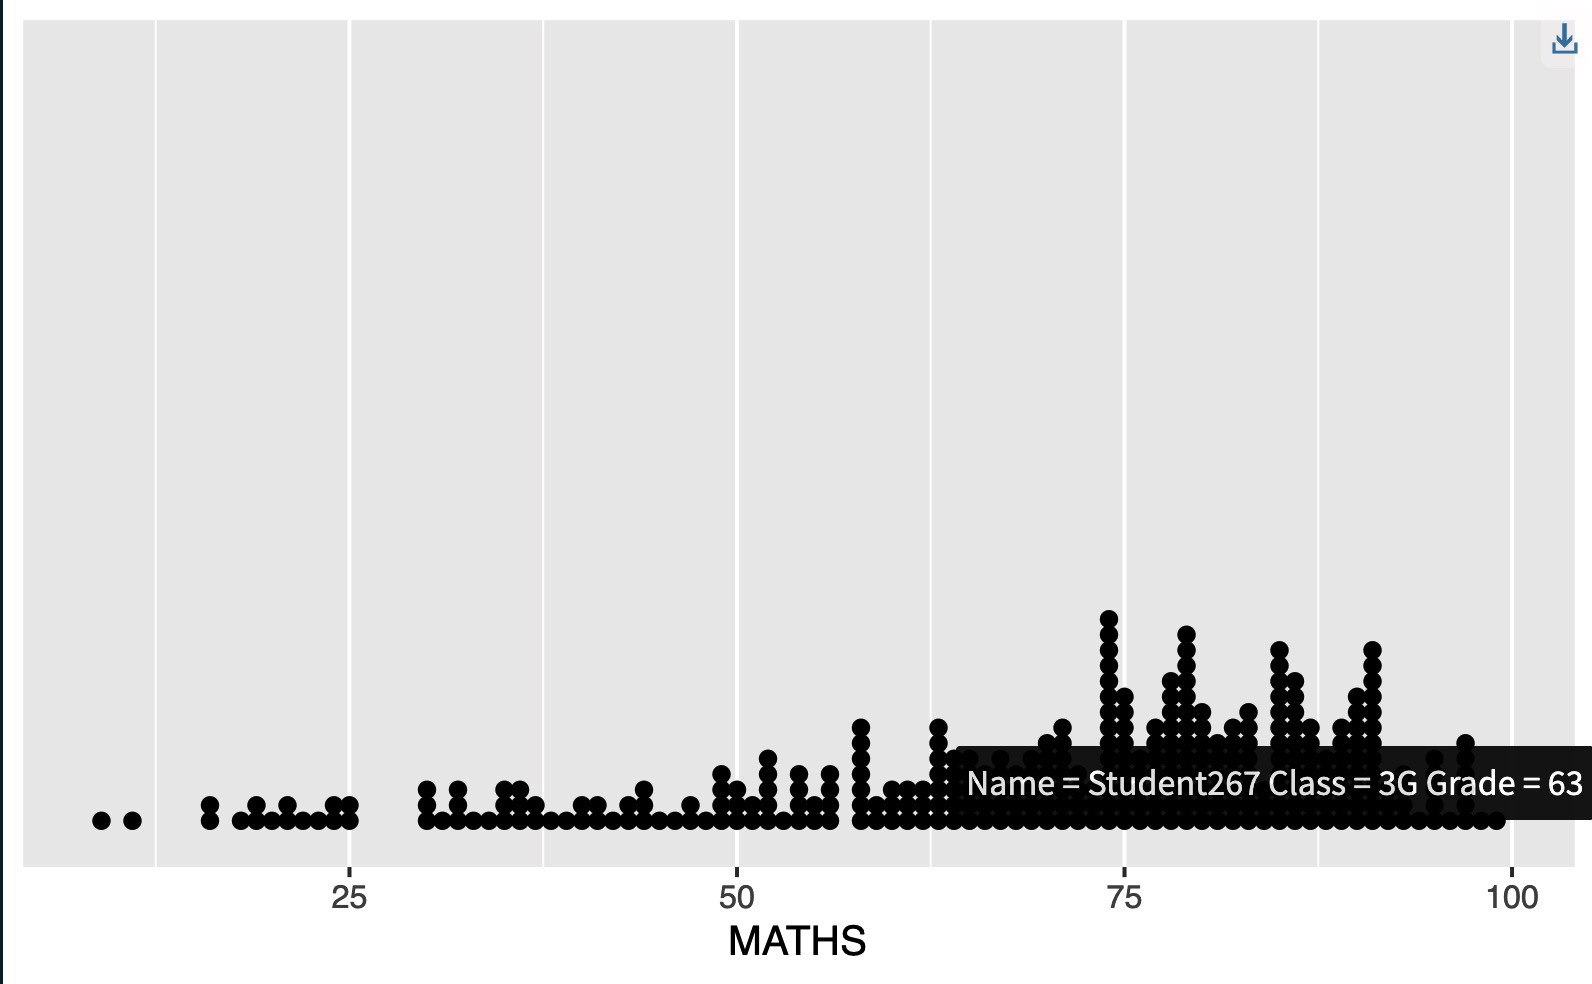
Creating 1st data visualisation using ggplot package in R.
Interactive Data Visualisation with R.
Fundamentals of Visual Analytics with R
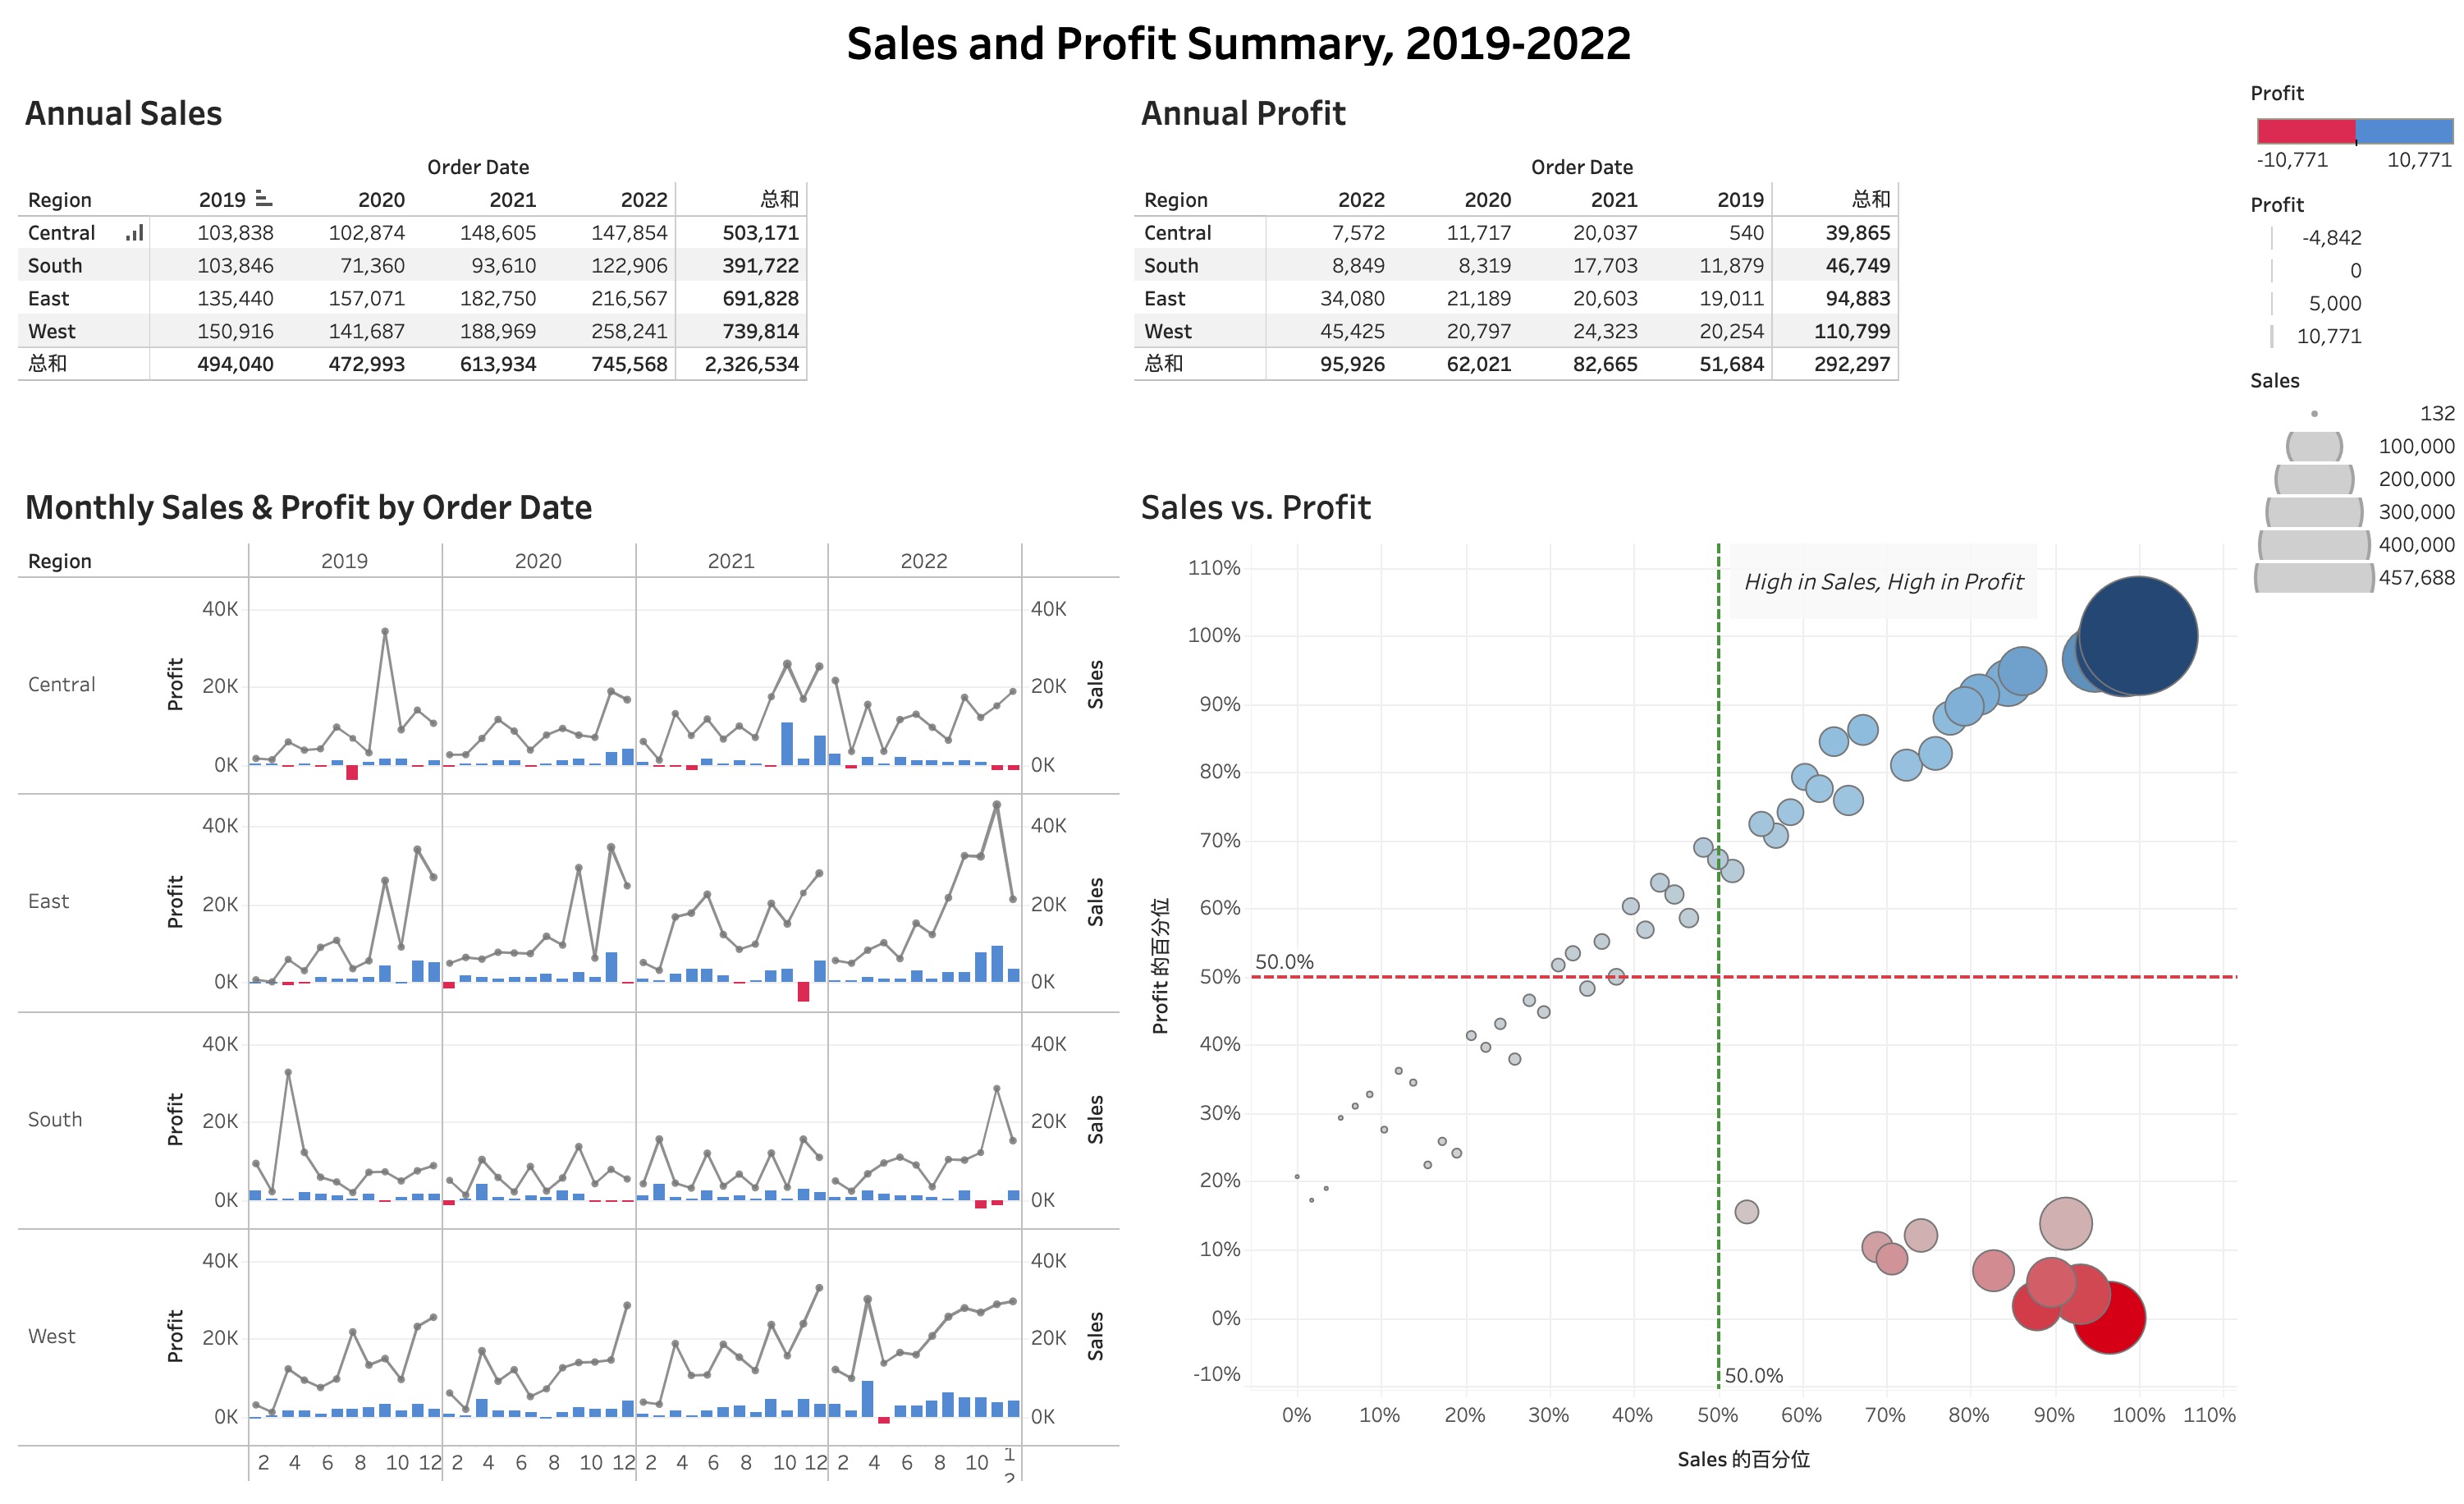
Visualization of Sales and Profit Summary of a store using Tableau Desktop.
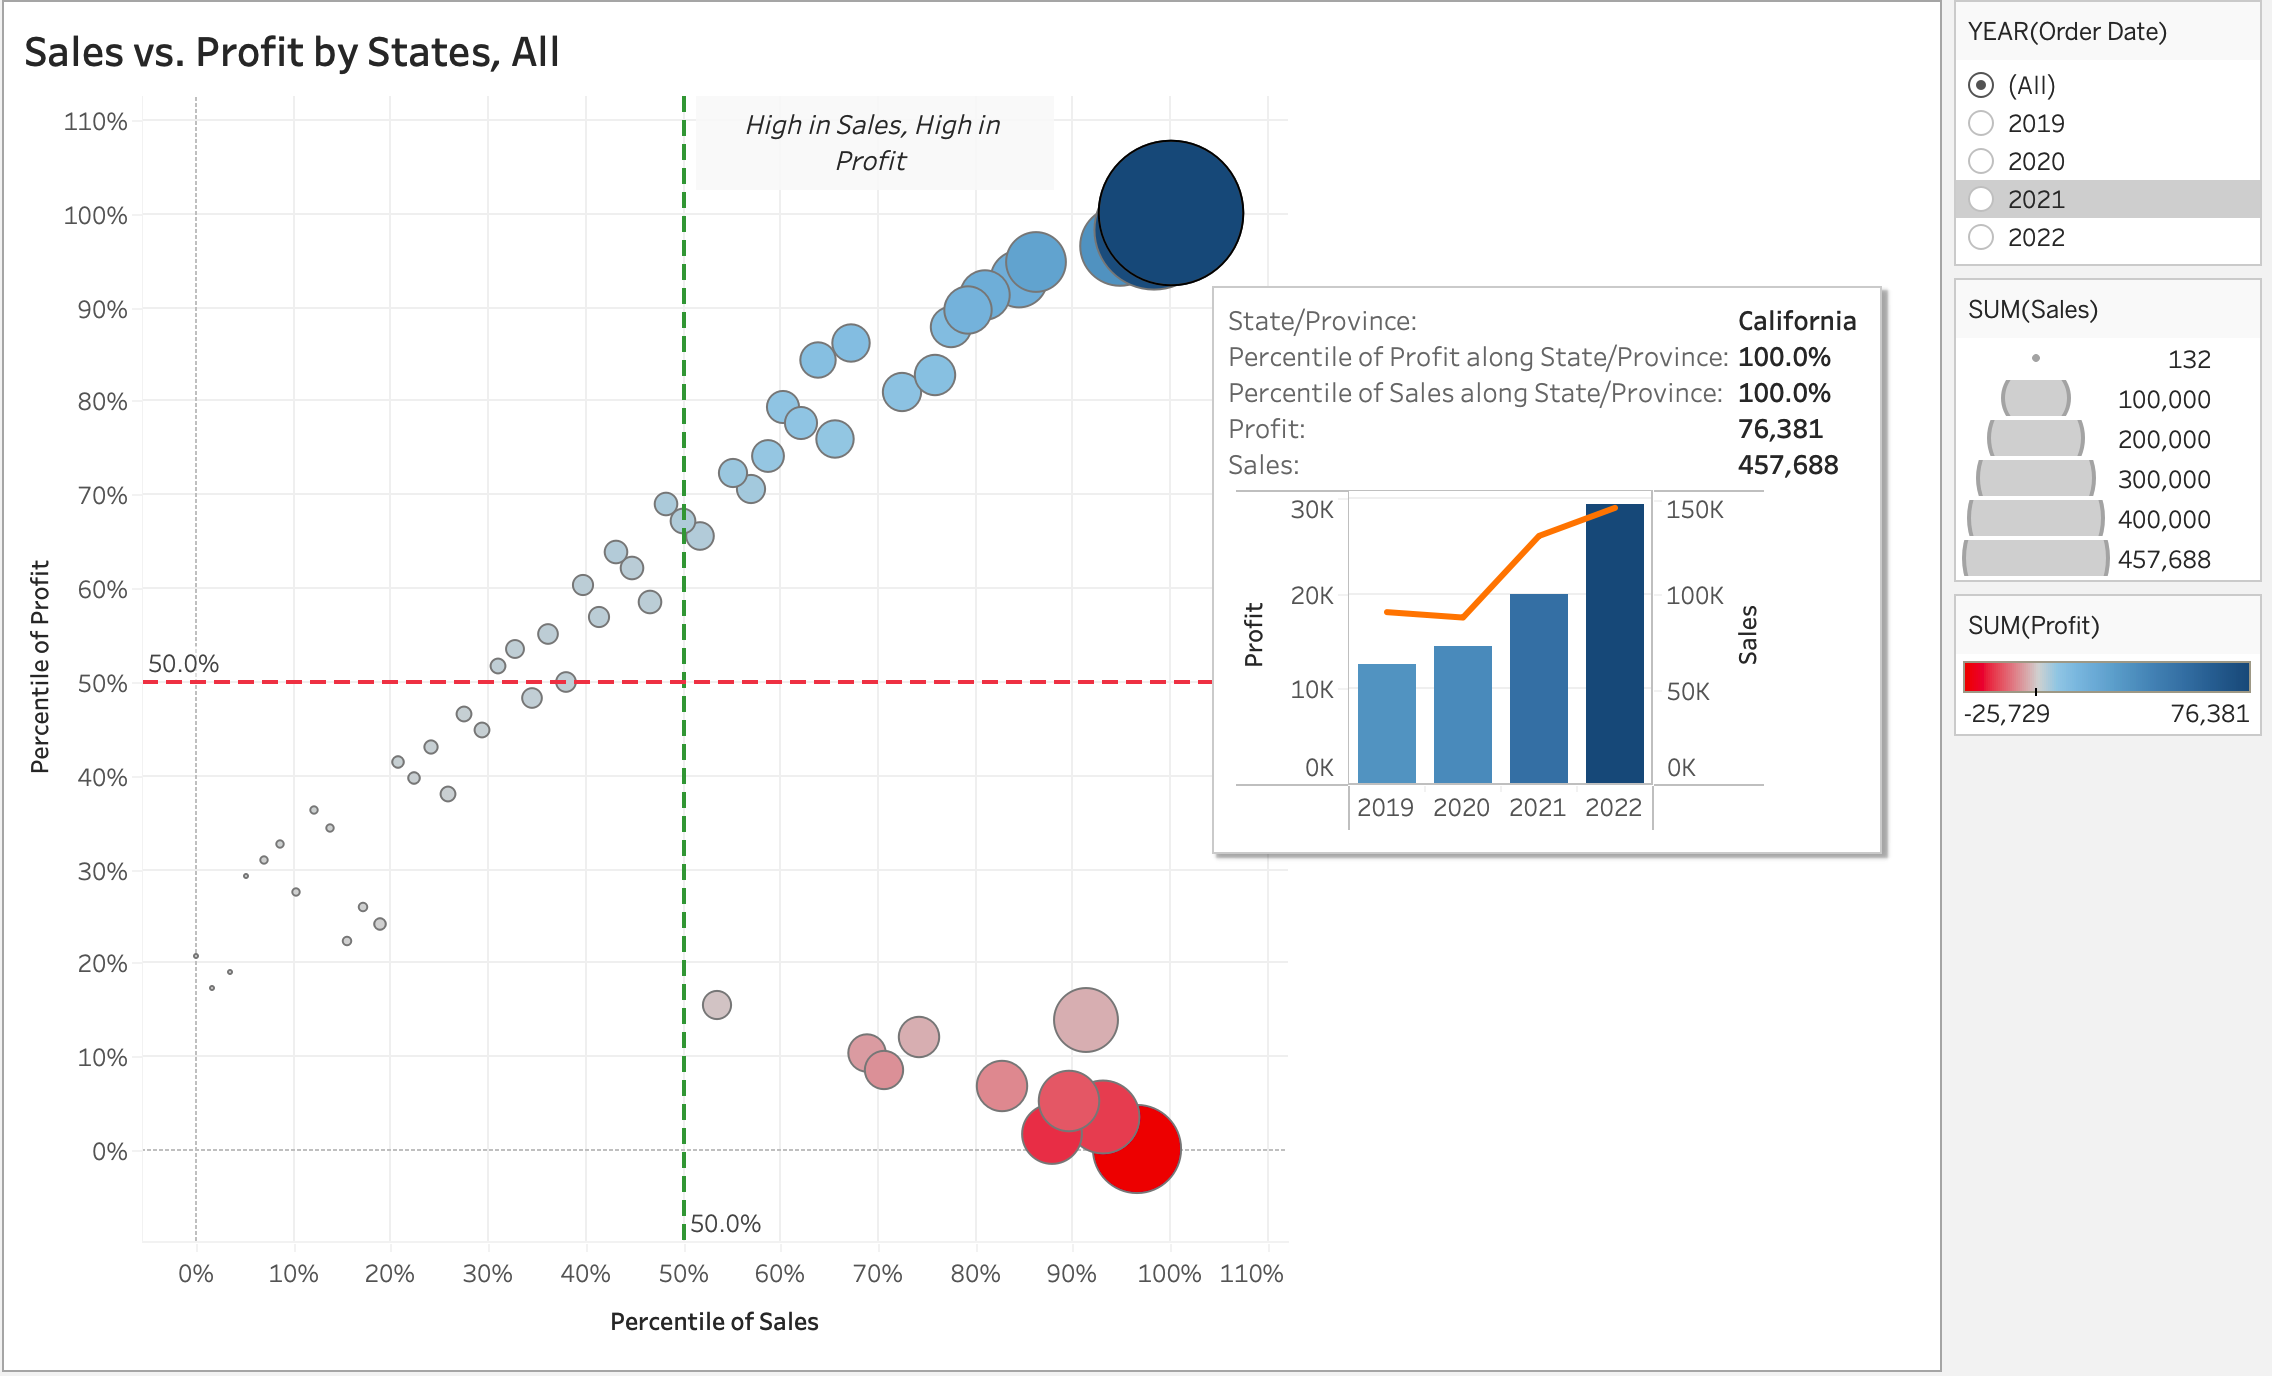
Exploring interactivity in visual analytics using Tableau Desktop.
Exploring interactivity in visual analytics using R.
R: Fundamentals of Visual Analytics
R: Visual Multivariate Analysis
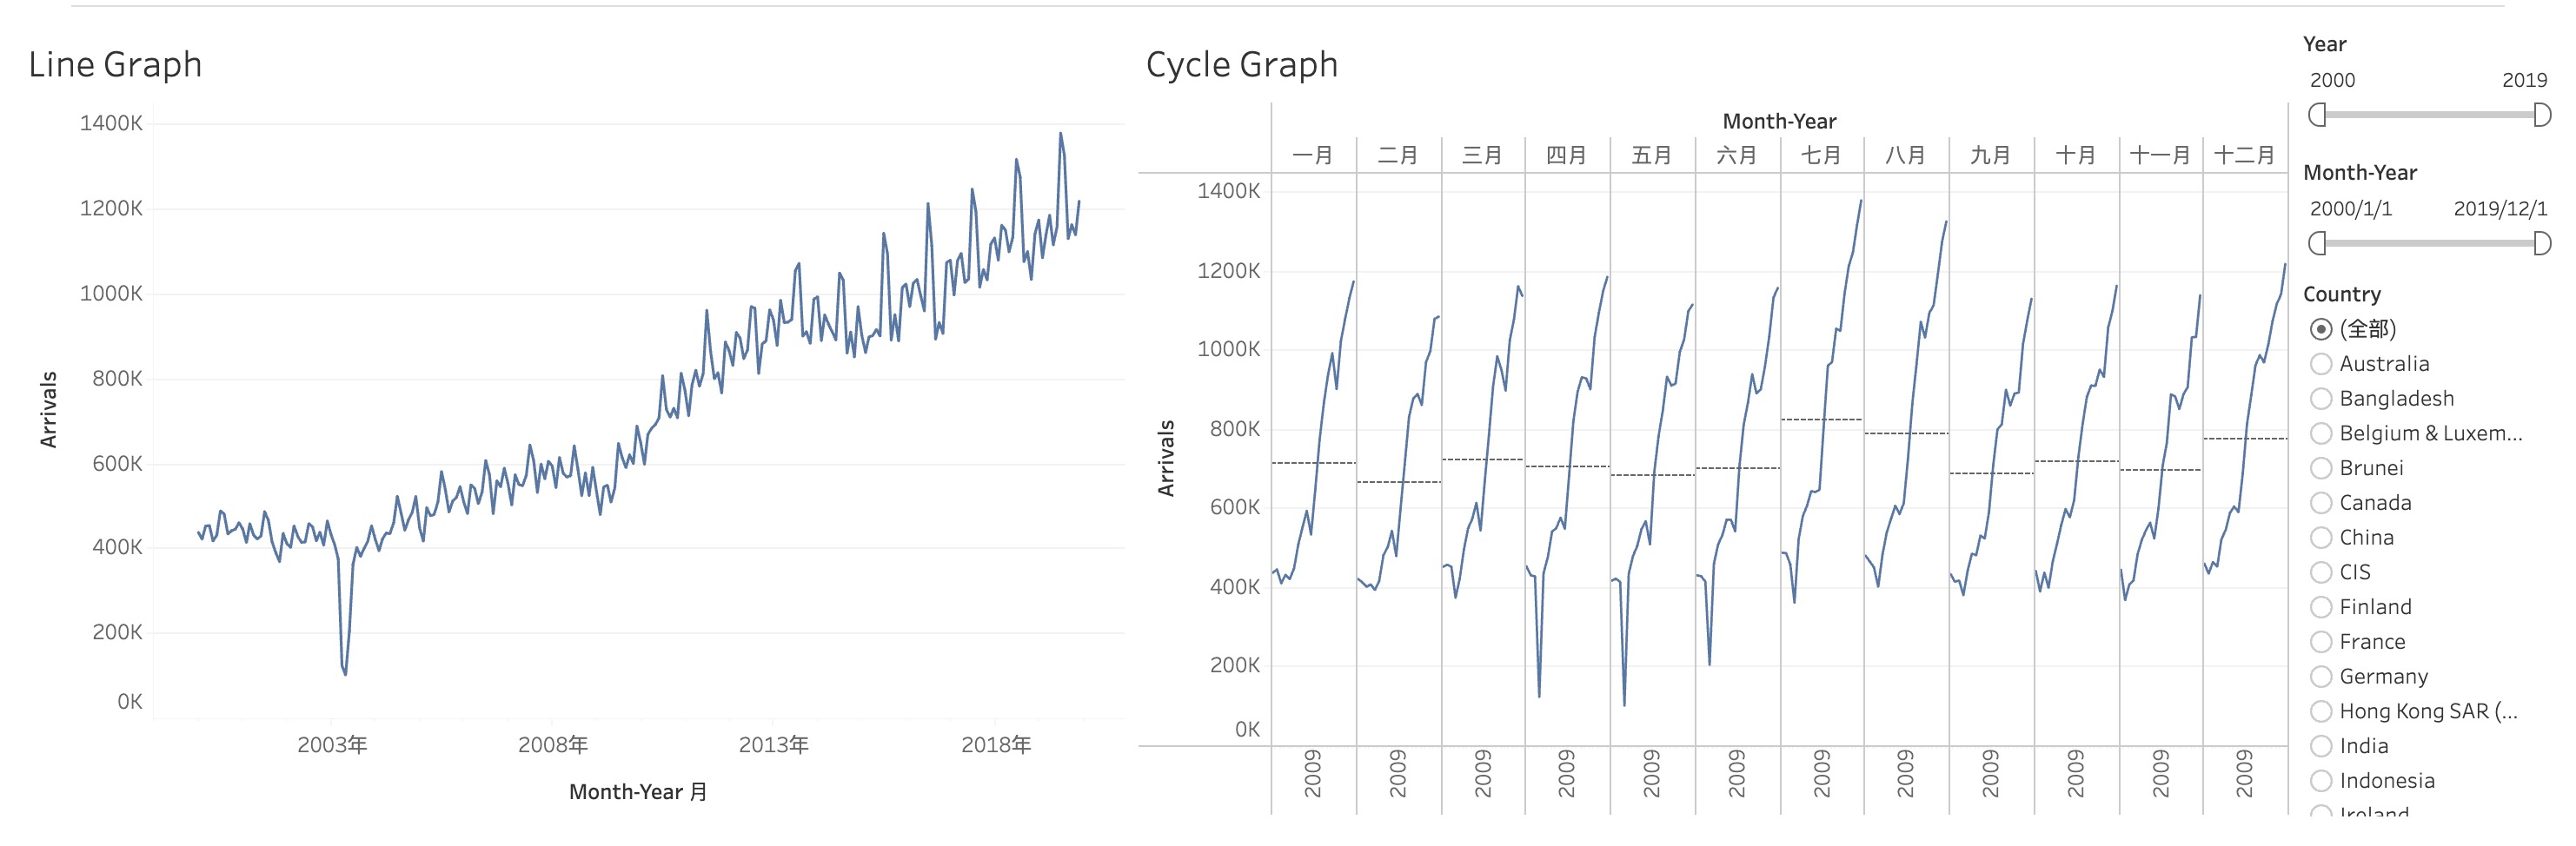
Various types of visualization of time-series data using Tableau Desktop.
Visualize geospatial data with Tableau Desktop/R.
Visualize network graph data with R.
Create information dashboards with R.
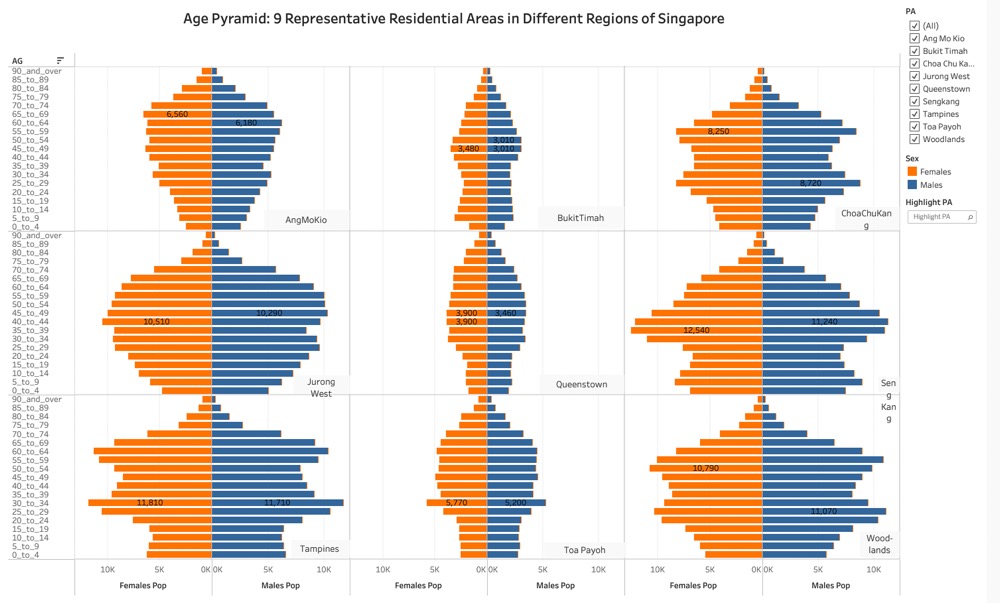
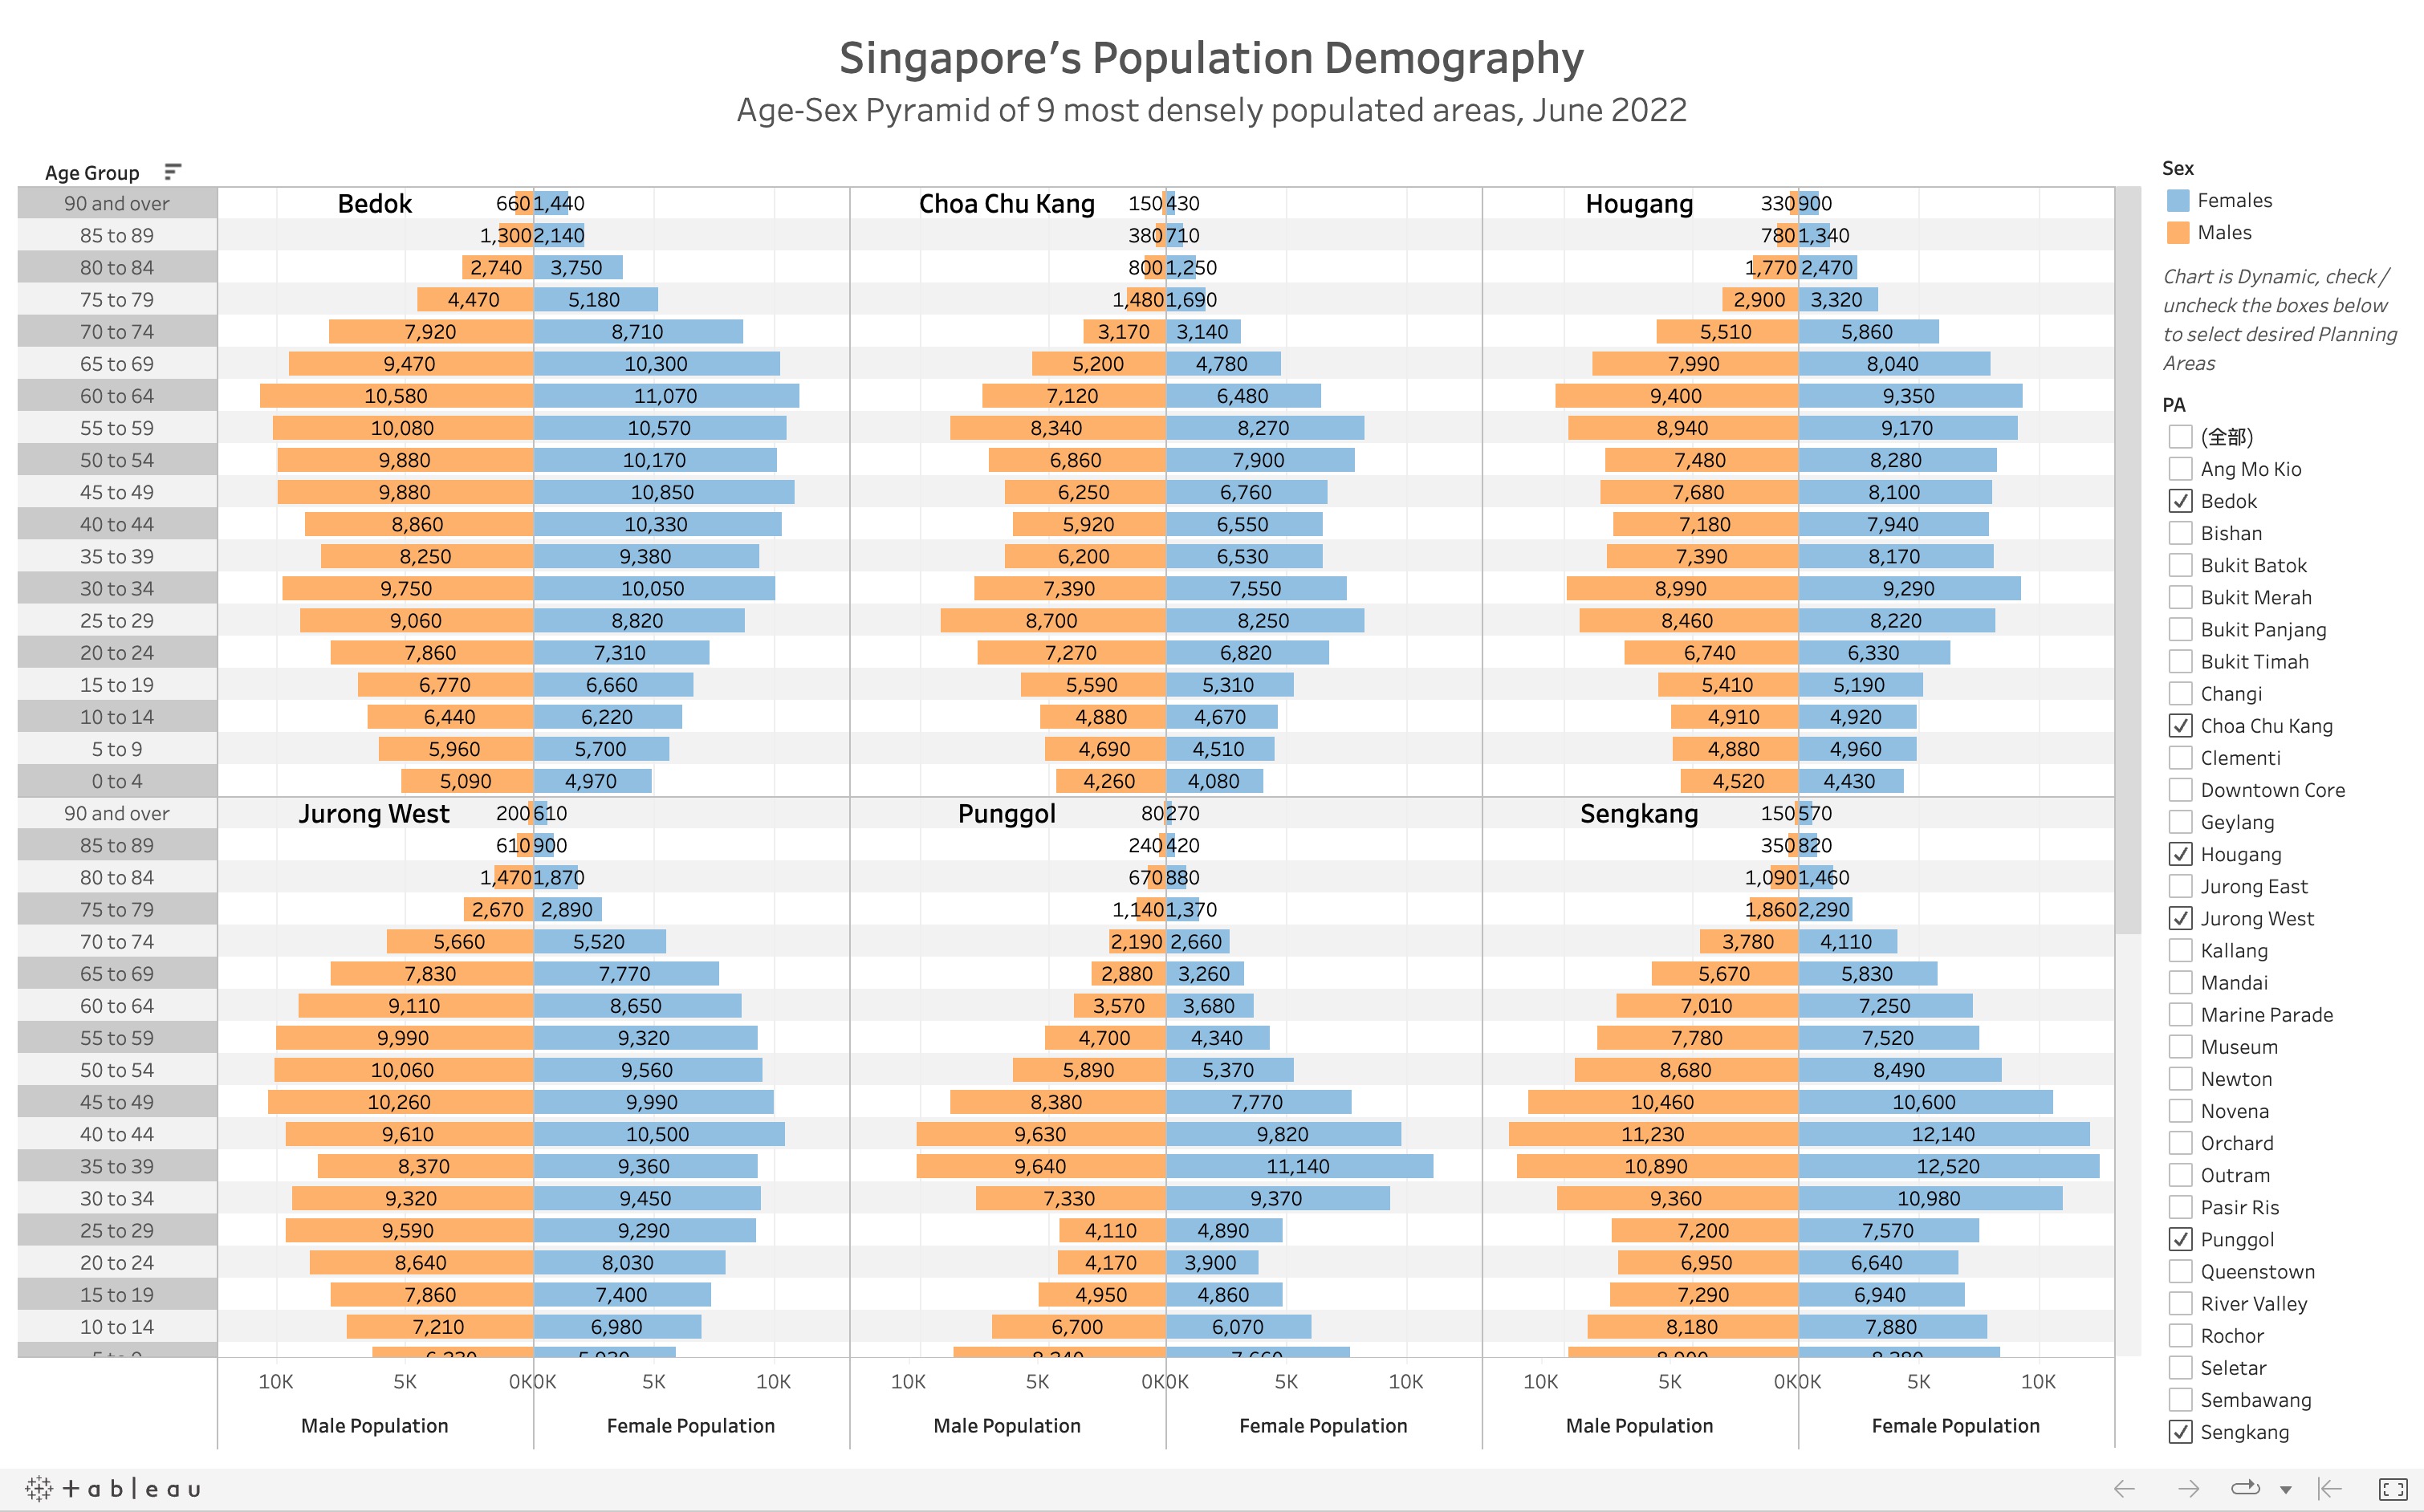
Reveal demographic structure of nine selected planning areas on a single view by using trellis display.
Take-home exercise 2 is a review of take-home exersise 1 of our peers; critics and adjustment is done using R graphical packages, based on some of the areas of improvement in the work.
The focus of this exercise is to perform insightful data visualization to uncover the salient patterns of the resale prices of public housing property by residential towns and estates in Singapore.
This take home exercise aims to uncover the impact of COVID-19 as well as the global economic and political dynamic in 2022 on Singapore bi-lateral trade by using various analytical visualisation techniques.